Climate Change in the Northeast: New Tool from Cornell’s Climate Smart Farming Program
Mar. 25th 2019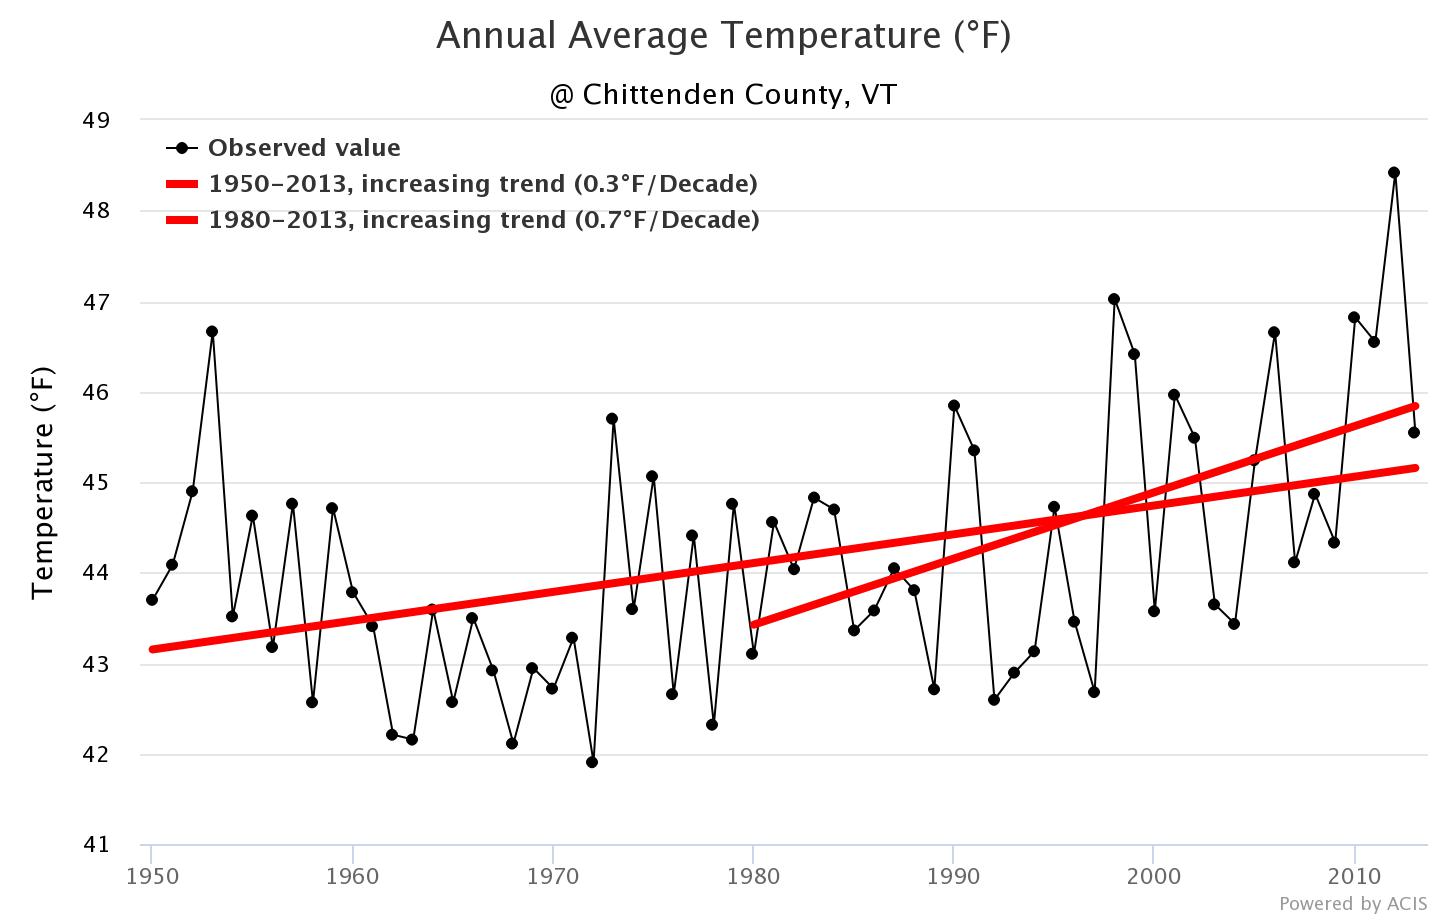
A new online tool from Cornell’s Climate Smart Farming Program has been developed to help farmers and other residents of the Northeast understand how the local climate has changed since 1950.
Developers of the tool, Art DeGaetano and Brian Belcher of the Northeast Regional Climate Center and Cornell Institute for Climate Smart Solutions, wanted to create something that was easy for farmers to use for their specific location.
The maps and projections were developed using temperature and precipitation data from the National Weather Service. The Applied Climate Information System (ACIS) provides access to the climate data used to develop the online tools.
The free online tool allows users to zoom in on any county in the northeast to see temperature and precipitation trends that have occurred since 1950, and projections of future climate change through the end of the century.
In Vermont, average temperature has increased by more than 0.7o F per decade in six of the 14 counties. This increase appears to be primarily driven by warmer low temperatures, rather than high temperatures, in which nine of 14 low temperatures have increased, but only two of 14 high temperatures have increased as dramatically. The tool also allows investigation of growing season length and growing degree days in each county.
Precipitation trends have also been increasing throughout the state; some Vermont counties have seen increases of more than 3.00 inches per decade. There are more intense precipitation events now than in the past. Changing precipitation patterns can affect when farmers can get crops in the ground and the types of crops that are best suited to the region.
Future projections to 2100 can be reviewed under two different carbon emissions scenarios. For example, in Addison County, under a low emission scenario, annual average temperature is expected to rise by about 7oF (from 43oF in 1950 to 50oF in 2100); under the high emissions scenario, the difference will be an increase of 12oF (from 43oF in 1950 to 55oF in 2100).
Farmers can use the projections to consider future conditions when planning investments on their farm. The tool can provide projections on future growing season length, allowing farmers to identify crops that may be better suited to the future climate. Other investments may be necessary if farmers plan for new crop types. For example, new harvesting or processing equipment may be needed for new crops, or irrigation needs may change under future climate scenarios. The projections can help farmers make the best decisions for their needs and specific climate. Because the maps cover the entire northeast, farmers can explore patterns in other regions and identify suitable crops that may have previously been used further south in the region.
The tool is useful to not only farmers and gardeners, but also local land managers and municipal officials who may need to better understand climate when planning for infrastructure development to best manage for types and amounts of precipitation or changing temperatures. It’s also a fantastic educational resource for teachers to really show the local impacts of climate change.
Check out Cornell’s Climate Smart Farming (CSF) program for more information on the CSF Climate Change in your County tool, or other CSF Resources for farmers on climate change adaptation and mitigation.