 ecoNEWS VT
Flood Inundation Maps of the Lake Champlain Basin
Nov. 14th 2016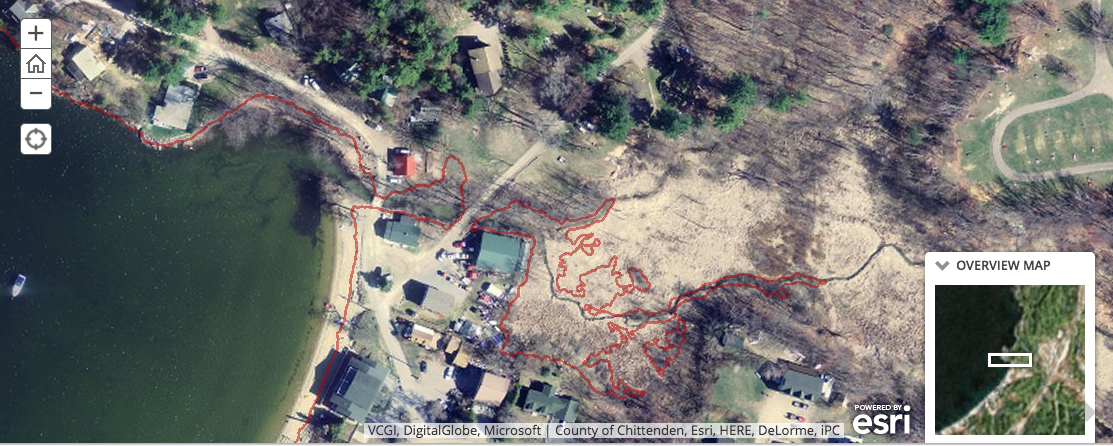
Lake Champlain reached record levels in the spring of 2011 from storm events and snowmelt. These floods devastated communities. State and local communities are acting now to be better prepared for future floods. An important key to better preparation is anticipating the extent of flooding at different lake levels. Communities can limit development in these areas and have plans in place for handling floods in areas that are already developed.
The water level of the Richelieu River, the outlet of Lake Champlain, at Rouses Point, NY reached a maximum of 103.2 ft (National Geodetic Vertical Datum [NGVD] 29) on May 6, 2011. Minor flood stage at this gage is 100 ft (NGVD 29), as defined by the National Weather Service. Lake Champlain exceeded this level for 67 consecutive days.
In response to the floods, the USGS (for the US) and Environment Canada (for Canada), with funding from the International Joint Commission, developed flood inundation maps. The maps are intended to help residents, emergency responders, and communities react effectively during a flood event. The maps represent potential flooding along the shore of Lake Champlain and in major tributaries in four counties in Vermont (Addison, Chittenden, Franklin, Grand Isle) and one in New York (Clinton).
Researchers determined static flood boundary extents for Lake Champlain in Addison, Chittenden, Franklin, and Grand Isle Counties in Vermont and northern Clinton County in New York. The researchers used lidar (light detection and ranging) data, which may be referenced to any of the five USGS lake gages on Lake Champlain. The flood boundaries outline the extent to which land is submerged in water, or inundated. They created eleven inundation scenarios corresponding to lake levels ranging from 100 ft to 106 ft. On each map scenario, the inundation level is represented by a red line. The lowest level and highest level (scenario 1 and scenario 11) can be compared directly in the tool. The effort will be completed in 2017 with recently acquired lidar for southern and southwestern areas of Lake Champlain (lidar for these areas was not available previously).
The maps correspond directly with other online tools, including the stage level at each of the gages and the National Weather Service forecasting location at the Richelieu River (Lake Champlain) USGS lake gage. Sufficient detail is available in the maps to view roads, bridges, culverts, and homes when zoomed in. During a storm event, predicted or actual stage level can be used to determine the expected area of inundation and necessary steps to protect people and infrastructure. Flood inundation maps help communities protect lives and property by providing tools and information to help them understand their local flood risks and make cost-effective mitigation decisions.
The map scenarios present a simple, easy-to-use tool to quickly discover if a particular location is at risk of being flooded. Emergency responders can plan for road closures and other infrastructure damages and can inform residents to evacuate if homes are at risk of flooding.
The map scenarios complement other mapping tools and resources from Flood Ready Vermont.
Click here to view the flood inundation maps on the International Joint Commission website.