 ecoNEWS VT
Floodplain Mapping Tool for Conservation and Restoration Planning
Jul. 12th 2022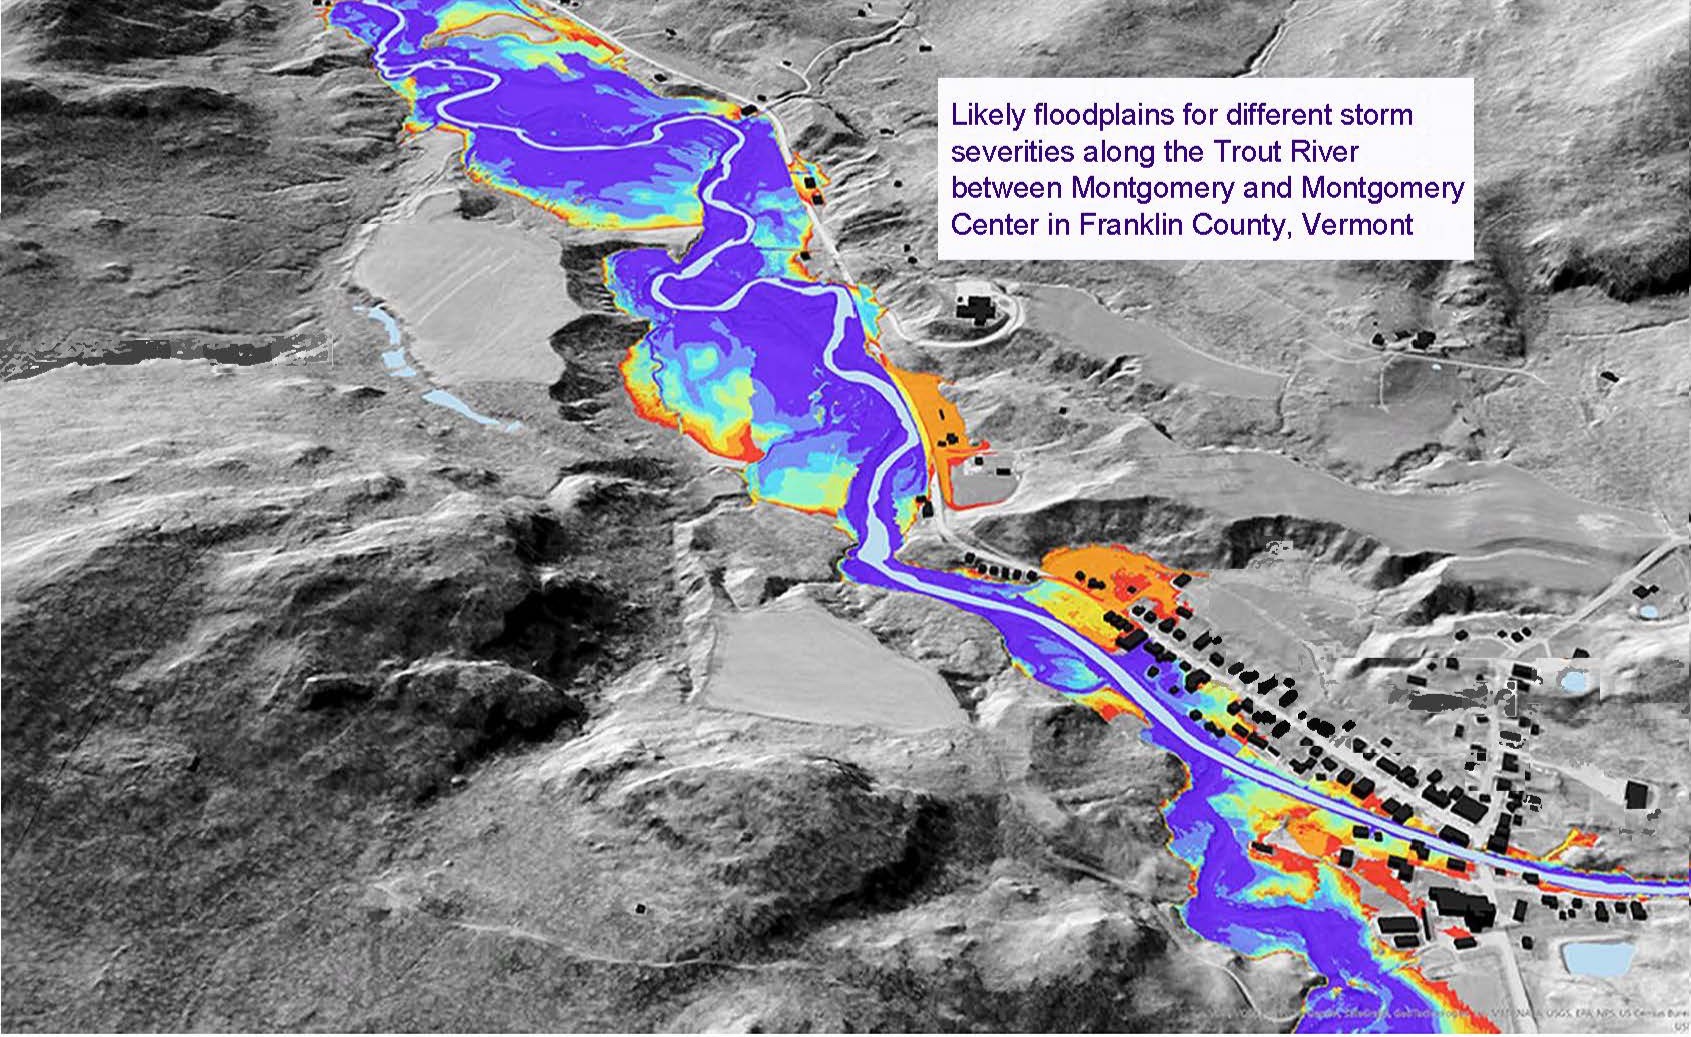
Land use planners and researchers in Vermont now have access to maps that show how floods of different sizes are expected to spread across surfaces within river valleys.
Created to show a simplified representation of what different severity flood zones might look like across the landscape for conservation and land-use planners, each color on the maps represents how water that spreads out from riverbanks might look for eight storm sizes, from 2-year to 500-year flood probabilities.
Researchers at the University of Vermont, Rebecca Diehl, of the Department of Geography, and Kristen Underwood, of the Department of Civil and Environmental Engineering, have generated a continuous map of topographically defined floodplains for Vermont’s Lake Champlain basin rivers that drain more than two square miles.
“This new mapping product also adds more detailed information on frequency of flooding by identifying the relative frequency of how rising water covers land features within the floodplain, ranging from frequently to rarely flooded,” said Diehl.
The maps rely on publicly available datasets including topography or measurement of elevations. Researchers used the state of Vermont’s publicly available high-resolution topographic data collected during airplane flights using Light Detection and Ranging (LiDAR), a remote sensing method that uses a pulsed laser light to measure distances to the Earth. The speed with which the laser beams bounce back to the detector in the plane gives information to determine the elevation of the land.
Floodplains maps are intended for planning and research use by government, academic, commercial, and non-governmental agencies. They offer a greater geospatial coverage of floodplains in the basin than Federal Emergency Management Agency (FEMA) Flood Insurance Rate Maps, but they are not a substitute for FEMA maps and are not intended for regulatory use.
"These flood inundation layers will support many regional studies,” said Underwood. “For example, we expect these maps could help state-wide decision makers to assess the spatially varying risks of extreme flooding events under a changing climate, including disproportional impacts on underrepresented populations."
This work contributed to Vermont’s Functioning Floodplain Initiative (FFI), a partnership between the state Agency of Natural Resources and other public and private entities, to develop methods and mapping to identify, restore, and protect high priority stream, wetland, and floodplain functions. Functioning floodplains support ecosystem services, such as:
- storing flood water temporarily to decrease peak flooding downstream;
- recharging ground water for drinking and irrigation;
- storing sediment/nutrients, such as phosphorus, to slow runoff and improve water quality; and
- storing carbon to help decrease greenhouse gases and mitigate climate change.
“These floodplain maps are a critical element of our work under the FFI to guide restoration and conservation planning for improved water quality, enhanced flood and climate resilience, and expanded habitat and ecosystem functions,” said Gretchen Alexander, who leads the FFI for the Vermont Department of Environmental Conservation.
Learn more about the floodplain maps on the Vermont Center for Geographic Information website.
Funding for the floodplain dataset came from many sources, including the Water Investment and Watershed Management Divisions of the State of Vermont Department of Environmental Conservation, Lake Champlain Basin Program, the Vermont Water Resources and Lake Studies Center (through USGS), Lake Champlain Sea Grant (through NOAA), the Vermont Center for Geographic Information, the Gund Institute for Environment at the University of Vermont, and The Nature Conservancy in Vermont.