 ecoNEWS VT
New Mapping Tool Identifies Vermont’s Environmentally Vulnerable Communities
Oct. 17th 2022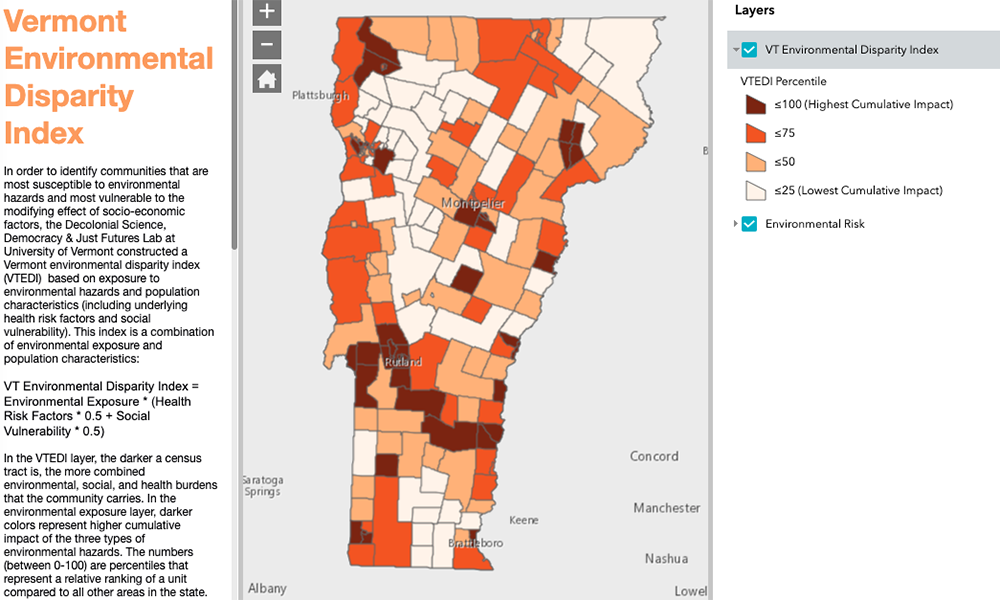
Until recently, Vermont was one of the few states without a state-adopted environmental justice policy. In May 2022, Governor Phil Scott signed Vermont’s first environmental justice policy into law.
The new law states that no Vermonter, because of racial, cultural, or economic status, should bear a disproportionate share of environmental burdens or be denied environmental benefits. The law ensures that policies and practices of state agencies do not unfairly burden low-income populations and communities of color. The law also establishes a mapping tool to identify communities where environmental risks have disproportionate impacts on Vermonters.
In 2016, the Vermont Department of Environmental Conservation (DEC) needed to develop an environmental justice policy to fulfill an EPA requirement. Researchers at the University of Vermont (UVM), in partnership with Rural Environmental Justice Informed by Community Expertise (REJOICE), assisted the DEC and conducted a study of environmentally vulnerable populations in the state. This recently published research led to the new state law and development of the new mapping tool called the Vermont Environmental Disparity Index.
Former PhD student Qing Ren and Associate Professor Bindu Panikkar created the Index, to measure cumulative impacts of environmental risk, social vulnerability, and health risk in Vermont communities. In collaboration with Research Associate Professor Gillian Galford, they used census tract data to assess the connection of race, poverty, food stamp use, and Limited English Proficiency (LEP) with exposure to environmental risks.
The study looked at several indicators of environmental risk. These include air pollution; polluting sites such as landfills, Superfund sites, hazardous waste sites, or brownfields; impaired surface waters; lead in school drinking water; flood risk; heat vulnerability; and traffic noise.
Findings
The mapping tool revealed that population areas with high environmental risks are concentrated in the Burlington metropolitan area of Chittenden, Franklin, and Grand Isle Counties; Washington County; and central Rutland County. Areas of high environmental risk were also found in parts of Caledonia, Orange, and Bennington Counties, and along the Connecticut River Valley in Windsor and Windham Counties.
Using the Disparity Index, the researchers determined that areas with high racial diversity and LEP residents are associated with greater environmental risks, while communities with the fewest minority or LEP residents have low environmental risks. The index showed those living in poverty and using food stamps also experience low environmental risks.
“We found greater environmental risks in communities of color and neighborhoods with more LEP residents than we found in lower income communities,” said Ren. “In Vermont, poverty is greater in rural areas where environmental risks tend to be lower. It may also be that food stamp use is not as prevalent in communities of color and that public assistance funds are more utilized in the rural areas in the state.”
Specifically, population areas with more minority, non-white, and LEP residents are more likely to have higher exposure to poor air quality and polluting sites and are more vulnerable to rising temperatures.
“This study demonstrates that regardless of the stature of Vermont as an environmentally progressive state, the five percent of its population that is non-white still bears higher environmental risks to legacy environmental pollutants,” said Panikkar.
Conversely, Vermonters living below the poverty line and using food stamps are less likely to experience air pollution or have polluting sites nearby but can be more vulnerable to heat. Population areas with the greatest poverty levels tend to have high levels of lead in school drinking water but are less likely to experience flooding and impaired surface water. Traffic noise did not show any clear patterns in the study.
The study found little overlap between high minority communities and low-income communities. Some census tracts in the rural north and northeast of the state are in the high poverty range, where environmental risks such as polluted sites and air toxins are relatively low. Communities with greater non-white populations are largely concentrated on the edges of urban areas.
“While there is little correlation between race and poverty in this study, it should not be interpreted that non-white populations are economically better off than white populations in the state,” said Ren. “It could be that poverty within these racially diverse tracts is not easily visible, as parts of the population within the tract have higher incomes.”
“Mapping is one way to understand environmental risks based on available spatial data, but not all data are easily available, such as how environmental benefits are distributed, so it is important to engage communities in these activities through participatory mapping exercises,” said Panikkar. “It is also important to understand the limitations within this tool and take quick action to alleviate disparities and prevent stigmatizing communities that have cumulative risks. With additional funding, community engagement, and community-based solutions, we can address local environmental justice concerns on the ground and work to redress environmental injustice.”
Dr. Ren serves on the Racial Disparities in the Adult and Juvenile Justice System Advisory Panel for the State of Vermont.
As one of the founding members of REJOICE, Dr. Panikkar continues to partner with local community groups such as the RENEW BIPOC Coalition, RELEAF, Vermont Natural Resources Council, the Environmental Justice Steering Committee organized by REJOICE, and Vermont State agencies as they work towards implementing the environmental justice law.