 ecoNEWS VT
Understanding Forest Health in Vermont Using FEMC Online Tool
Oct. 28th 2019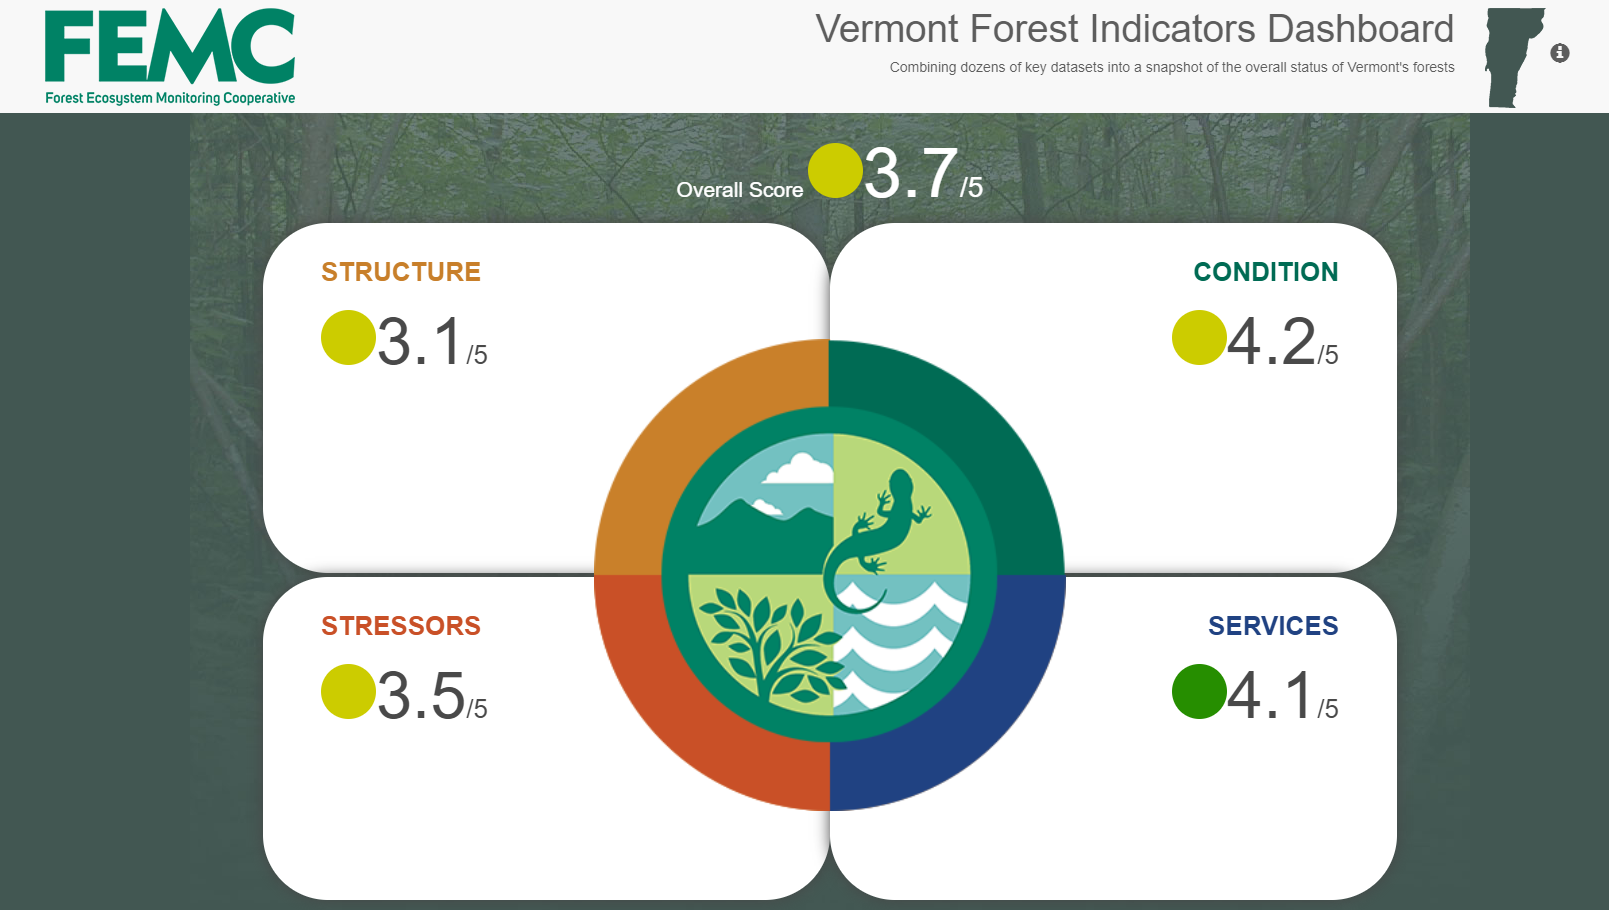
The Vermont Forest Indicators Dashboard (FID) is a new online tool developed to help understand, assess, and monitor the condition of forested ecosystems across Vermont. The dashboard builds on a dynamic database of key forest health metrics and ecological and economic indicators. It provides easy access to current and historical data, trends in conditions, and an aggregate annual score for forest ecosystem health and function.
The FID was developed in part by a working group led by Jennifer Pontius, Research Associate Professor at the University of Vermont and Principal Investigator of the Forest Ecosystem Monitoring Cooperative (FEMC), at the 2015 Annual Conference of the FEMC (known as the Vermont Monitoring Cooperative at the time). FEMC staff and collaborators further enhanced the tool following the initial working group meeting, where they determined specific datasets and indicators used to measure a variety of forest health, function, and ecosystem service metrics.
“While there are many organizations working to assess individual components of forest ecosystems, FEMC stakeholders identified a need to aggregate information across forest health, wildlife, water quality, and economic datasets to capture a more holistic view of the current state of the forest resource and the services it provides,” Pontius said. “This is just one example of what the FEMC is designed to do: identify a stakeholder need and bring together the experts and information available to develop tools to better understand, monitor, and manage northeastern forests.”
The purpose of this online tool is to provide an annual snapshot of forest ecosystem health and function that can be used to monitor changes in key indicators, provide early alerts of any threats to the forest system, and improve our understanding of the condition and function of Vermont’s forests. The online interface includes visualization and data download functionality to allow users to easily see a broad overview of conditions, examine long-term trends, drill down to individual datasets, or read more detailed information about each metric and its relevance to forest ecosystem health.
The interactive dashboard aggregates datasets into one of four categories used to capture the condition of Vermont forest ecosystems:
- Structure (e.g. patterns of forest cover, regeneration, and species distribution)
- Condition (e.g. the overall health and growth rate of trees)
- Services (goods and services provided by forested ecosystems)
- Stressors (environmental conditions that are harmful to forests)
Individual datasets include 33 indicators such as: forest cover, annual tree growth, carbon storage, acid deposition, timber production, and damage by invasive pests. FEMC staff and advisers calculate an annual score for each of the indices using the most recent datasets available and compare current values to historical baselines or expert-identified thresholds. Scores for individual metrics are then compiled and analyzed to calculate an overall weighted score for each category (Structure, Condition, Services, and Stressors) on a scale of 1 to 5. Scores closer to 5 suggest healthier or better conditions. Each index also receives a colored rating to describe long-term trends. A red circle indicates that the overall trend is getting worse; yellow indicates stable conditions; and green indicates an improvement to conditions over time.
Index and aggregate scores are updated annually to provide a long-term dataset of changes to forest ecosystem health and function in Vermont. Pontius describes the long-term application of the tool, stating, “Being able to quantify and track conditions in complex ecosystems is challenging but critical to our ability to identify impacts of current stressors like climate change, invasive species, and development pressures, and to assess the success of various policies and management strategies we employ.”
Currently on the 1 (poor) to 5 (excellent) scale, Vermont forests receive an overall score of 3.7, with component scores being 3.1 for Structure, 4.2 for Condition, 4.1 for Services, and 3.5 for Stressors. While some individual metrics show concerning trends (such as hardwood regeneration rates), trends in overall conditions are stable.
This tool provides easy access to a wealth of information that can be used by land managers and decision-makers to help inform forest ecosystem management and policy, to track trends over time, and to recognize potential signs of changes to forest health. But the Vermont Forest Indicators Dashboard is also a great way for anyone who cares about the forest resource to track how forest are responding to the many stressors they currently face.
Check out the Vermont Forest Indicators Dashboard here.